Introduction
Setup
To get started, first log in to the service using the AuthComponent. Right-click on the "Provider" text and choose your login method: Google, Maffeis domain, or Maffeis username and password.
Next, use the UnitsComponent to select your preferred unit system. Right-click on the "Units System" text and select either metric or imperial units.

Geometry
To link geometry, you can either pass a surface to a Brep component or select a surface in Rhino, then right-click on the Brep component and choose "Set one Brep."
Built-up
Materials
The materials available for your built-up include glass, interlayer, and air materials.
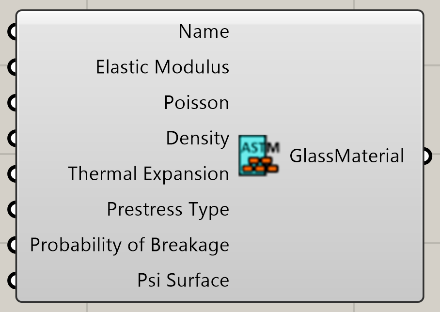
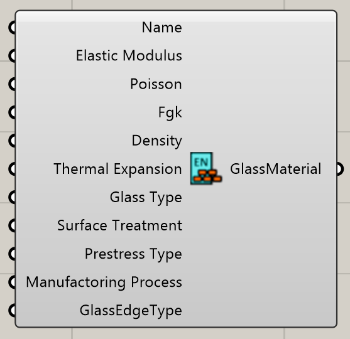
Glass materials
There are two types of glass materials available: those that follow the ASTM standard and those that follow the EN16612 standard.
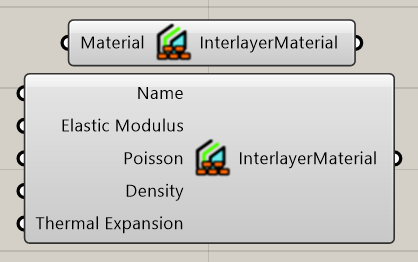
Interlayer materials
You can select interlayer materials in two ways:
- Database: Right-click on the "Material" option in the first component to choose from our database of interlayer materials.
- Custom: Use the second component to input custom specifications.
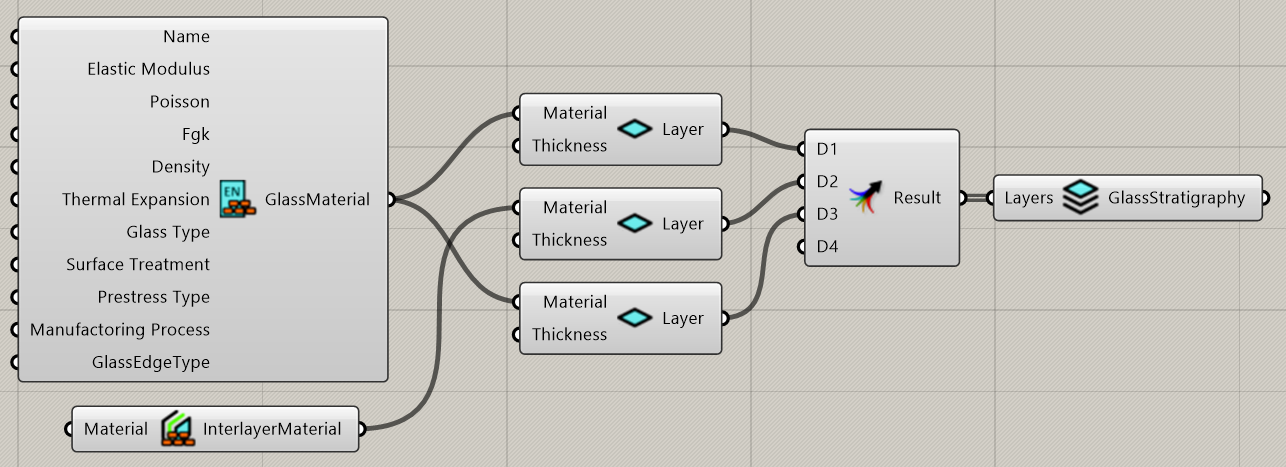
Stacking Layers
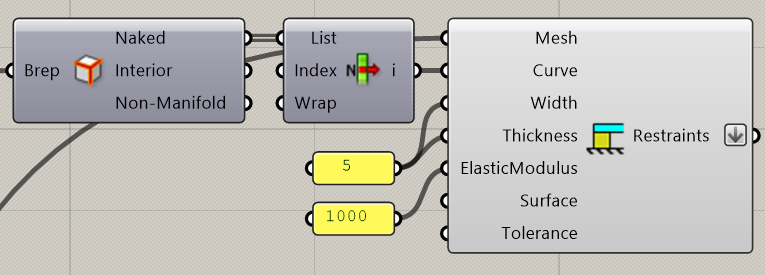
To define the thickness of a material layer, link the material to the LayerComponent and assign the desired thickness.
Once all individual layers are configured, merge all LayerComponents into the StratigraphyComponent to create the complete IGU (Insulating Glass Unit) built-up.
The 3D structure is created by extruding from inside to outside along the mean of the normals in each point.
Loads and Mesh
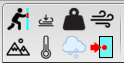
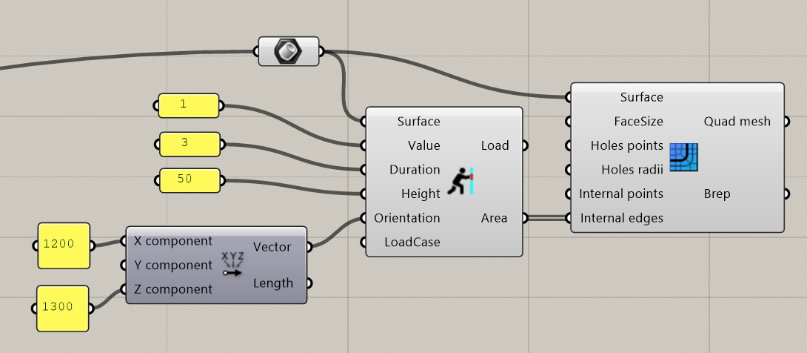
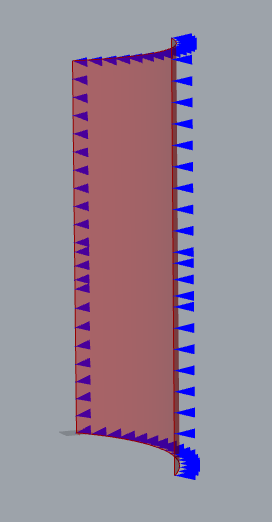
These are the multiple types of loads icons that can be applied to the IGU.
Example: barrier load
The Barrier Load component works by intersecting the glass surface with a horizontal plane at a specified height. The resulting area is then used as input for the Rhino Quad Mesh component as its Internal Edges.
Restraints
Example: Z support on all edges
The following blocks are for fixing the z direction in all sides.
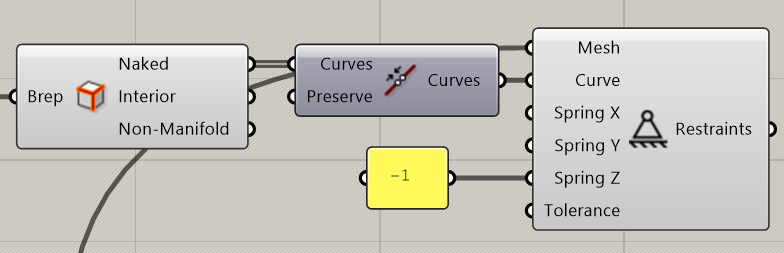
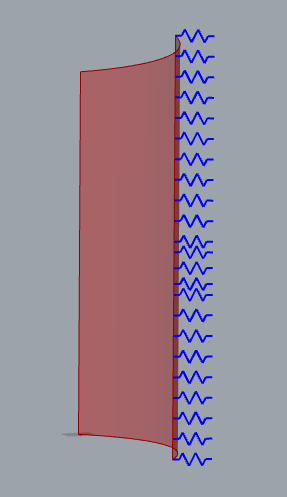
Example: silicone support on one edge
Load Combinations
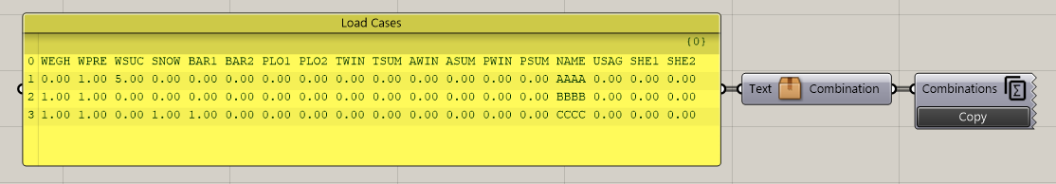
Use the yellow panel in the template above to define the coefficients for your load cases. Each row represents a single load case. Column codenames:
- WEGH: dead load (weight)
- WPRE / WSUC: wind pressure / suction
- SNOW: snow load
- BAR1 / BAR2: barrier loads
- PLO1 / PLO2: point loads
- TWIN / TSUM: temperature winter/summer
- AWIN / ASUM: altitude winter/summer
- PWIN / PSUM: pressure winter/summer
- NAME: name of the load case
- USAG: type of check — 0: none, 1: strength, 2: deflections
- SHE1 / SHE2: shear modulus of first/second interlayer
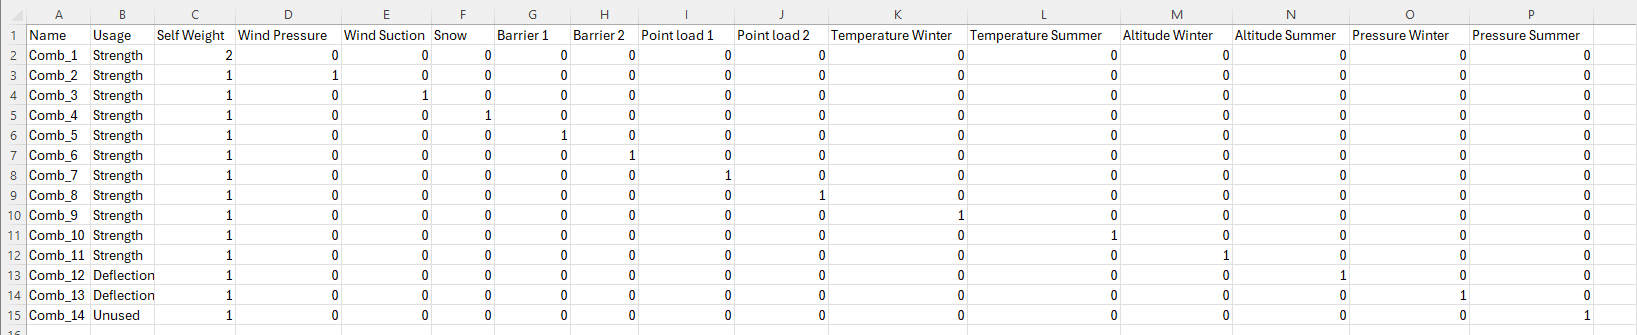
You may edit the parameters in each column, but keep in mind:
- Do not remove any columns or change the column names, as this will cause errors.
- You are free to add or delete rows as needed.
Once modified, select the table in Excel and use the Paste button in the template to import the load combinations back into Grasshopper.
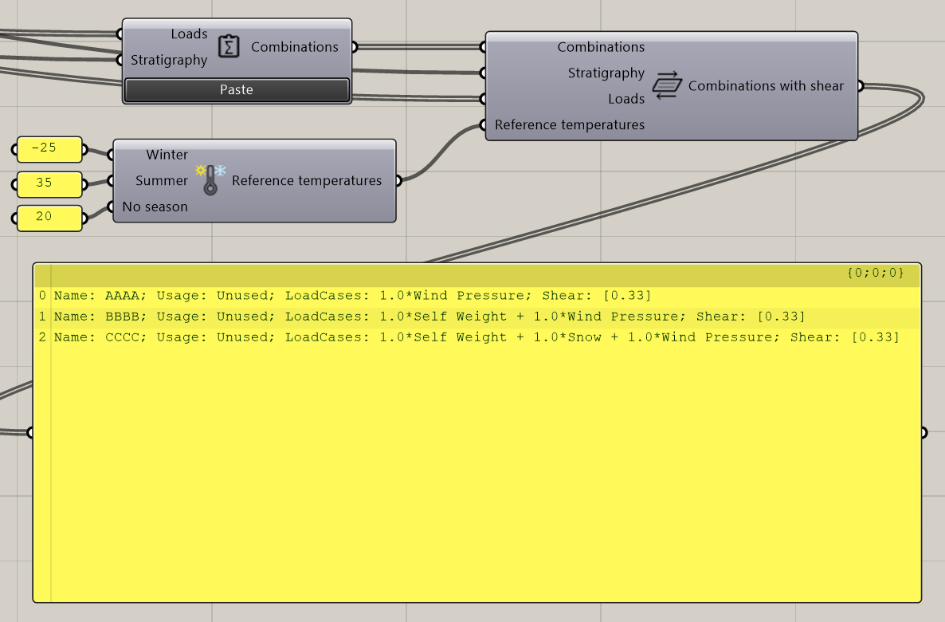
Connect all outputs to the Add Shear component and use the Reference Temperatures panel to apply seasonal temperature variations.
Calculation
The Glass Analysis component processes all the previously defined quantities, a selected standard, and the analysis options. The calculations are sent to our cloud servers for processing, which then returns the analysis results.
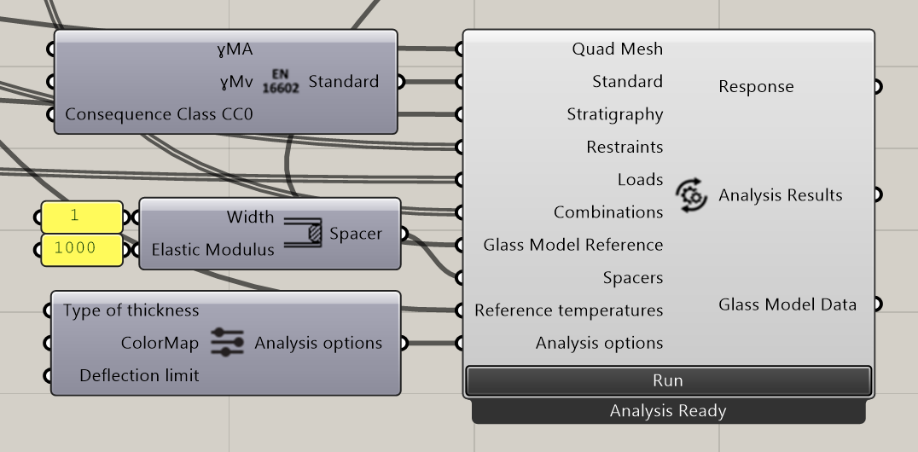
This example demonstrates the application of the EN16602 standard with a spacer inserted into the cavities. Use the available Analysis options to control visualization and analysis parameters.
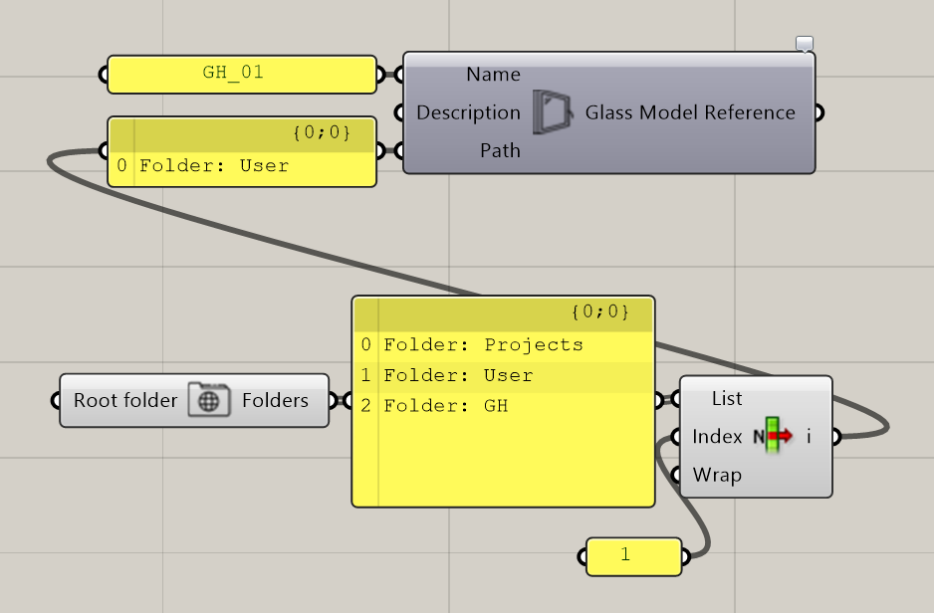
First, use the component circuit to select the folder and file name where the analysis results will be saved. Next, connect the output of the Glass Model Reference to the input of the Run Analysis component.
Results
Use the following circuit to see the output of the analysis.
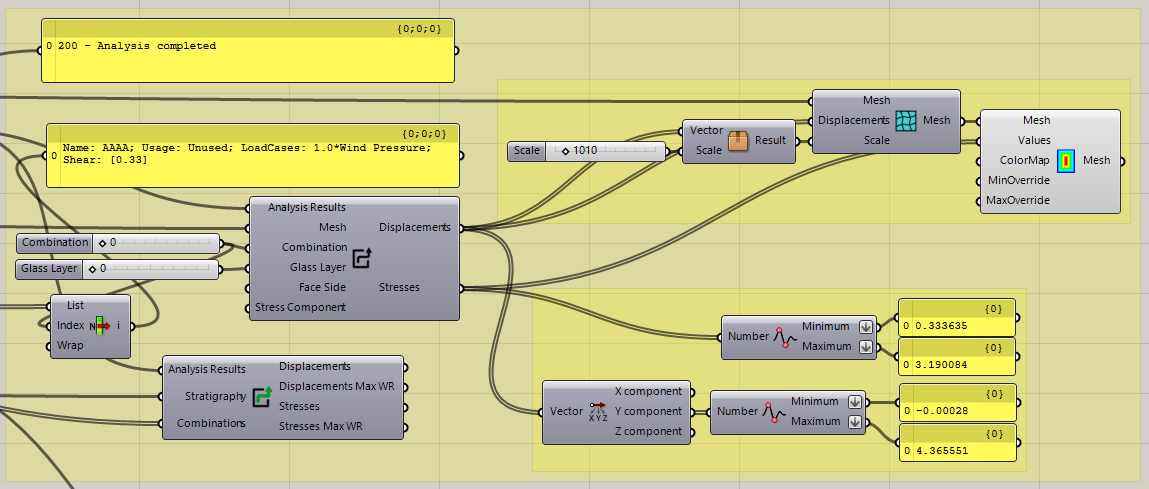
First, choose the combination number and glass layer. Then, configure the viewing direction by right-clicking the face side and selecting Inside or Outside. Finally, right-click on the Stress Component menu to select the desired stress for visualization:
- σid: Von Mises stress
- σx / σy: Global x and y stresses
- σ1 / σ2 / σ3: Principal stresses
- τxy: Global xy shear stress
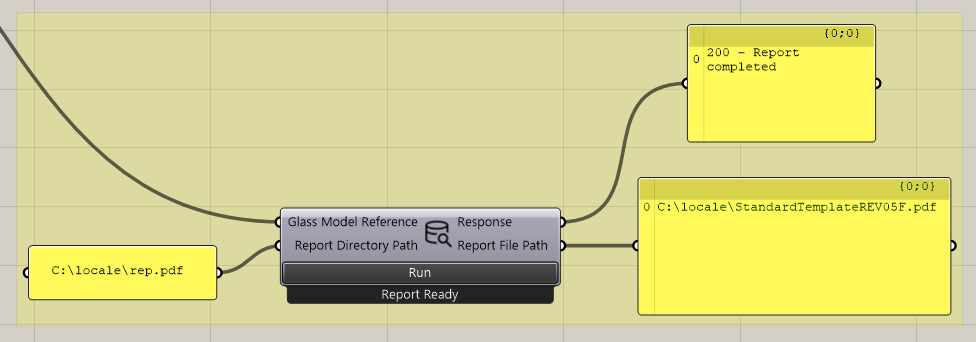
Use the component shown above to create the PDF report of the analysis. The generated report will be available at the report file path on your computer.